Data Analytics Is More Than Dashboards: A Practical Guide to Making Better Decisions
A dashboard can show that revenue has declined, customer engagement has changed, or operational costs have increased. But the numbers alone rarely explain what happened or what a business should do next.
That is where data analytics becomes valuable.
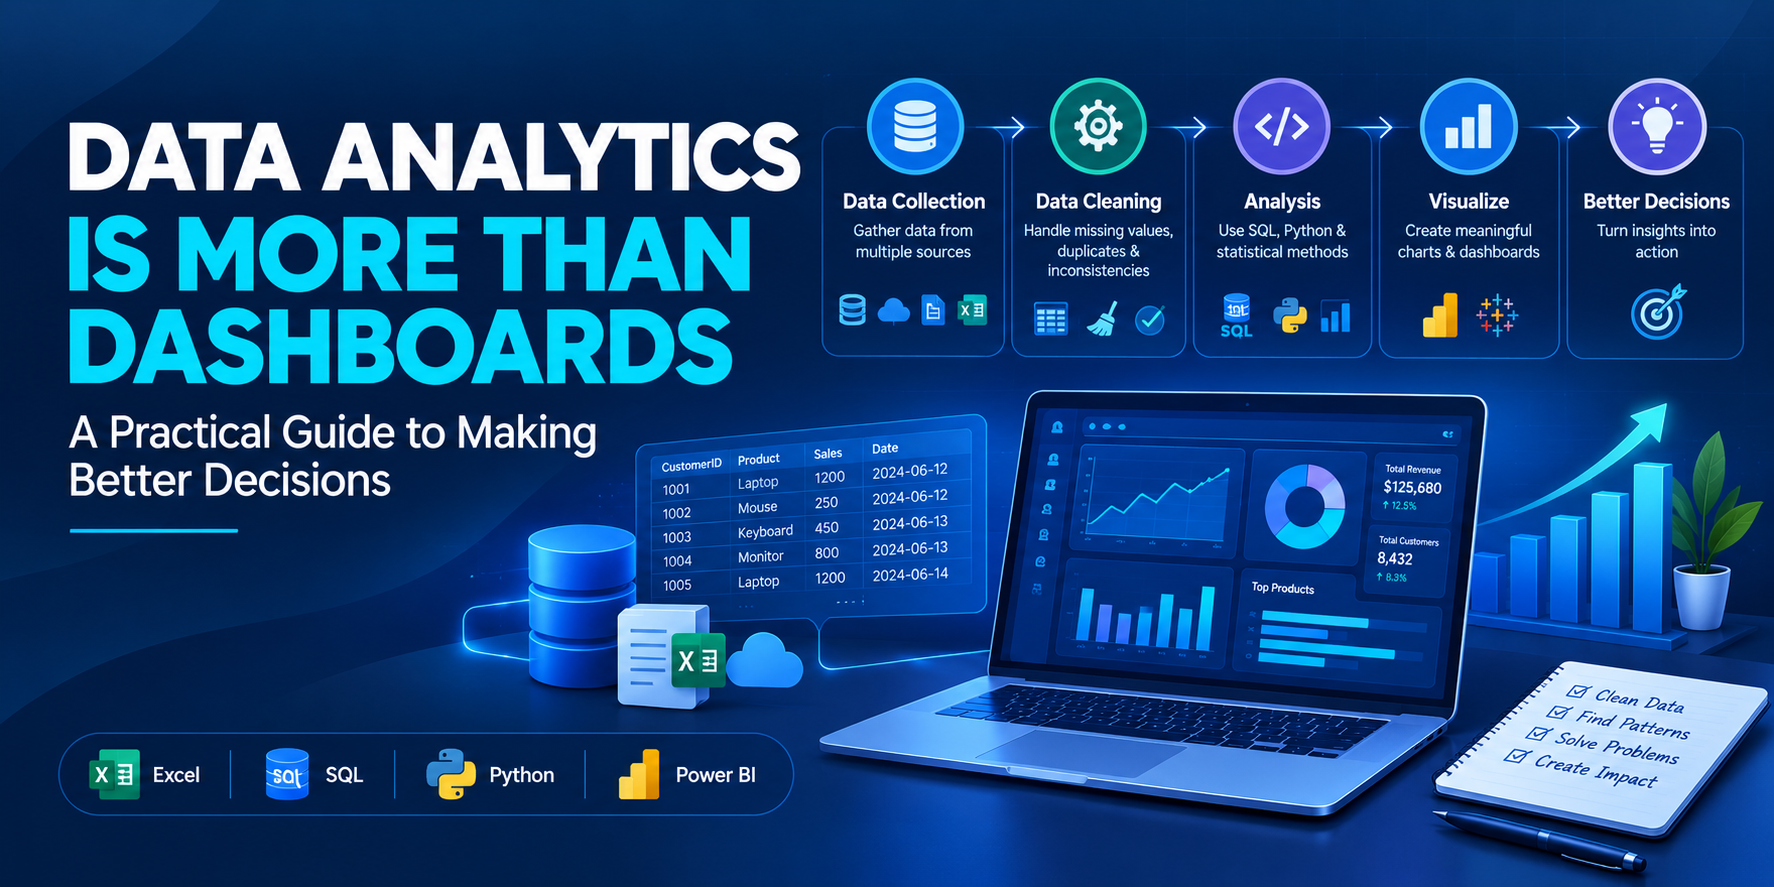
Effective analytics connects data preparation, statistical reasoning, business context, and communication. The objective is not simply to produce reports. It is to investigate meaningful questions, test assumptions, and help decision-makers understand the evidence behind their choices.
For learners exploring Data Analytics Training in India, understanding this complete process is more useful than focusing exclusively on software or visualization techniques.
Start With a Business Question
Every useful analysis should begin with a clearly defined question.
Suppose an e-commerce company notices that its monthly revenue has decreased. Immediately creating charts might reveal the decline, but it may not explain the underlying reasons.
A better investigation would consider questions such as:
Did the number of orders decrease?
Did the average order value change?
Are particular product categories underperforming?
Did customer acquisition or repeat purchasing change?
Are the results consistent across regions and time periods?
Breaking a broad problem into smaller questions helps identify the data required for analysis.
It also prevents a common mistake: exploring whatever data happens to be available without knowing what the analysis is supposed to accomplish.
Data Quality Comes Before Visualization
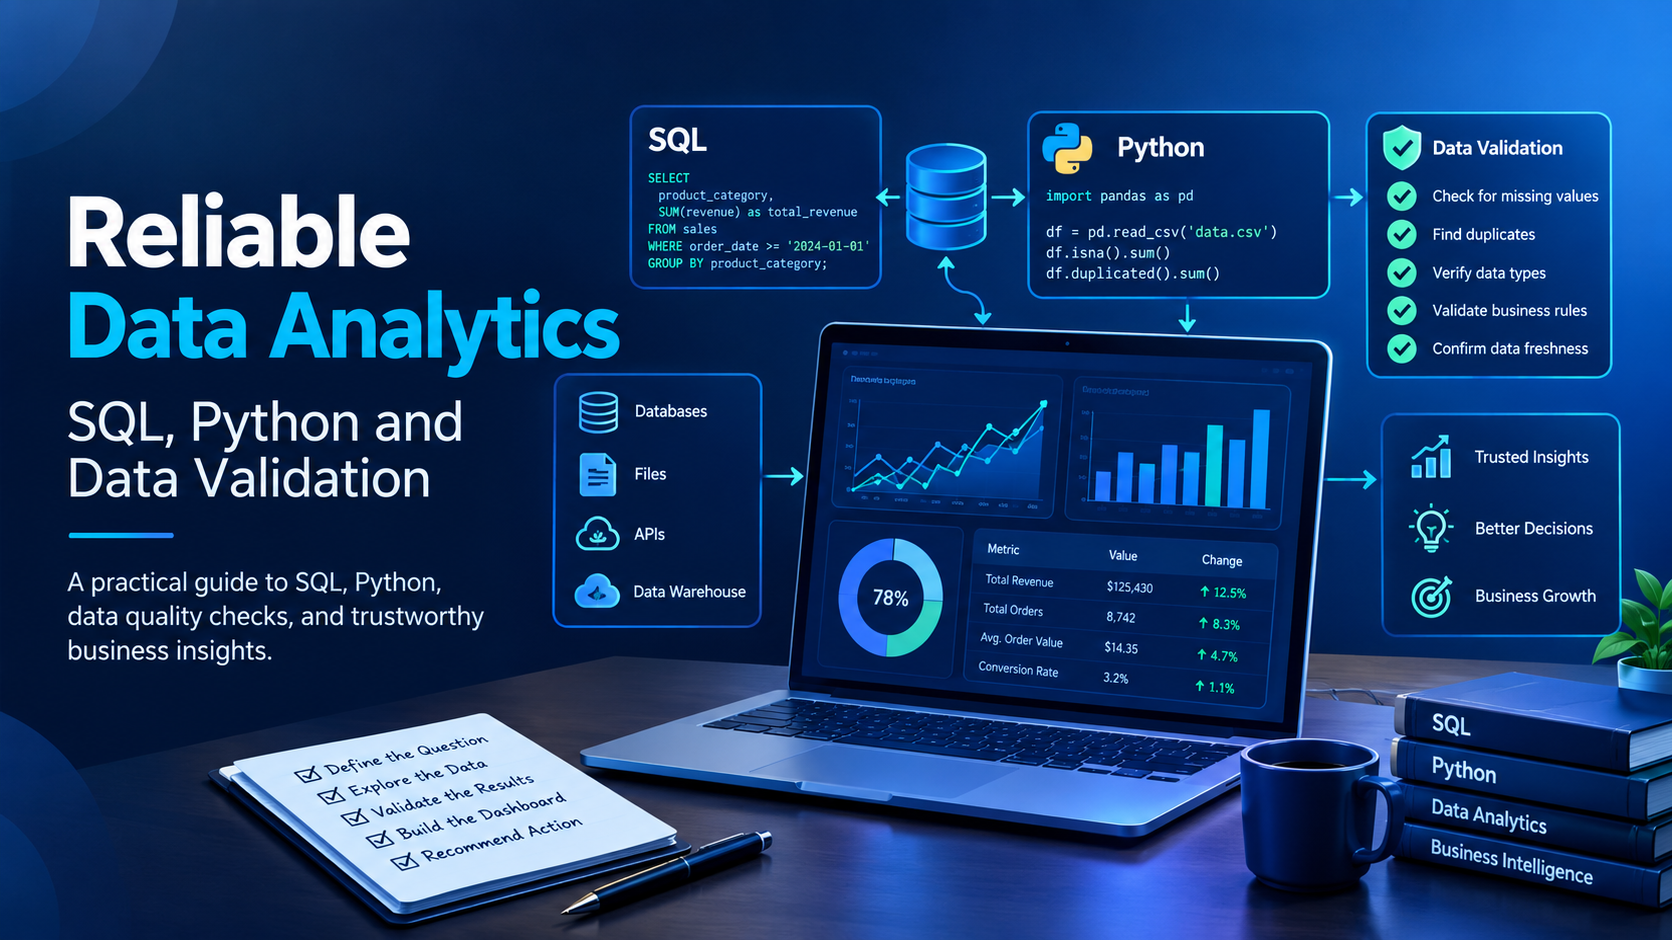
Business datasets frequently contain missing values, duplicate records, inconsistent categories, incorrect timestamps, and unexpected outliers.
If these issues are ignored, even an attractive dashboard can communicate misleading information.
Consider a sales dataset containing multiple records for the same transaction. If duplicate orders are counted as separate purchases, reported revenue and order volume may be overstated.
A reliable analytical workflow should therefore include:
Inspecting the dataset structure and available fields.
Checking for missing values and duplicate records.
Validating dates, numeric fields, and category formats.
Investigating unusual observations.
Documenting cleaning decisions and assumptions.
Confirming that calculated metrics match their definitions.
Cleaning does not mean automatically deleting every unusual value. An outlier might be a data-entry error, but it could also represent a genuine business event. Context should guide the decision.
How Excel, SQL, Python, and BI Tools Work Together
Data analytics is rarely about mastering a single application. Different tools support different stages of the workflow.
Excel for Initial Exploration
Excel is useful for reviewing structured datasets, checking calculations, using pivot tables, and producing quick summaries.
It can help learners understand the relationships between records, categories, and metrics before moving into more complex analysis.
SQL for Retrieving Business Data
SQL is essential when information is stored in relational databases.
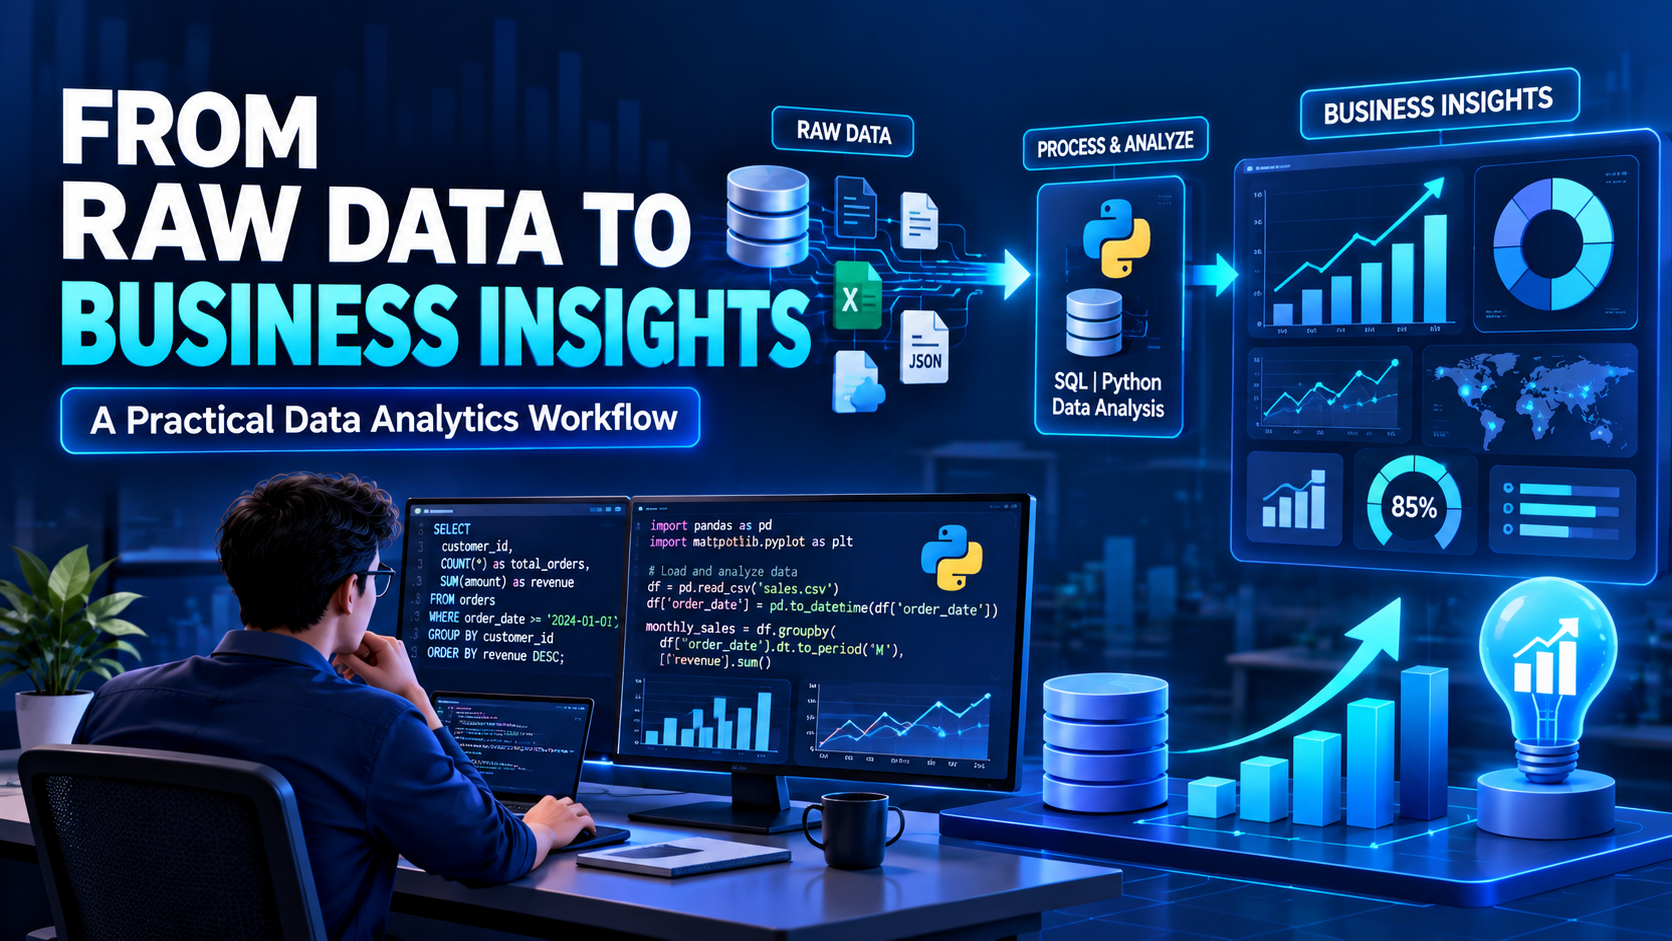
For example, an analyst may need to calculate monthly revenue from an orders table:
SELECT
    DATE_TRUNC('month', order_date) AS sales_month,
    SUM(order_amount) AS total_revenue,
    COUNT(DISTINCT order_id) AS total_orders
FROM orders
GROUP BY DATE_TRUNC('month', order_date)
ORDER BY sales_month;
This PostgreSQL-style query summarizes revenue and distinct orders by month. In an actual project, the analyst must also confirm that order_amount represents the correct revenue measure and that refunds, cancellations, and duplicate records are handled appropriately.
Python for Repeatable Analysis
Python libraries such as Pandas and NumPy help analysts clean datasets, transform columns, investigate patterns, and automate repetitive tasks.
Python becomes particularly useful when the same analysis needs to be repeated across multiple datasets or performed through a documented workflow.
Power BI and Tableau for Communication
Visualization tools help turn prepared data into dashboards and reports.
A useful dashboard should make important patterns easy to understand. It should use clear labels, appropriate comparisons, consistent definitions, and visual elements that support the questions being investigated.
The goal is clarity, not the maximum possible number of charts.
Metrics Need Context
Numbers can be technically correct and still lead to poor decisions if they are interpreted without context.
For example, a 15% increase in website traffic may appear positive. However, if qualified leads have decreased, the business may need to investigate traffic sources, conversion rates, audience relevance, or changes in the customer journey.
Similarly, a correlation between two variables does not automatically establish a causal relationship.
Strong analysts distinguish observations from explanations. They communicate what the data shows, what remains uncertain, and which additional evidence would help validate a conclusion.
This habit is especially important when analytical findings influence budgets, marketing strategies, or operational decisions.
Build a Project That Demonstrates Real Skills
A practical portfolio project should demonstrate the complete analytical process rather than only its final dashboard.
Consider a sales performance analysis project.
Step 1: Define the objective. Determine whether the goal is to understand revenue changes, identify high-performing products, or compare regional performance.
Step 2: Prepare the data. Check missing values, duplicate transactions, inconsistent categories, and date formats.
Step 3: Analyze the information. Use SQL or Python to calculate relevant metrics and investigate trends.
Step 4: Validate the findings. Check calculations, compare results across appropriate periods, and investigate unexpected patterns.
Step 5: Build the dashboard. Present the key metrics and findings using Power BI or Tableau.
Step 6: Explain the outcome. Write a short summary describing the findings, their limitations, and possible next steps.
Other useful projects include customer retention analysis, marketing campaign evaluation, inventory reporting, and customer segmentation.
For every project, document the dataset source, assumptions, methods, and limitations. Never present a hypothetical result as a verified business outcome.
How to Evaluate Data Analytics Training in India
When comparing Data Analytics Training in India, look beyond the number of tools listed in a course description.
A structured program should help learners understand how the tools fit together and when each method is appropriate.
Evaluate the following areas:
Technical foundations: Excel, SQL, statistics, data cleaning, and visualization.
Practical assignments: Opportunities to analyze datasets independently.
Project depth: Work that begins with a business question and finishes with an evidence-based explanation.
Analytical reasoning: Training in metric definitions, validation, and interpretation.
Learning support: Access to explanations, feedback, and guidance where available.
Career preparation: Portfolio presentation and interview practice, if relevant to your goals.
Learners comparing course options can review Data Analytics Certification Training in India by TechPratham to examine the curriculum and determine whether it fits their learning objectives.
A certificate may document course completion or assessment, depending on the program. It does not guarantee employment. Practical ability, communication, project quality, and interview performance also matter.
The Skills That Make Analysts More Effective
Technical proficiency is important, but effective analysts combine it with several professional habits.
Curiosity helps them ask better questions.
Attention to detail helps them identify inconsistencies before they affect results.
Statistical reasoning helps them interpret patterns without overstating conclusions.
Business understanding helps them connect metrics with organizational objectives.
Communication helps them explain complex findings in language that decision-makers can understand.
These skills develop through repeated practice, feedback, and careful review of analytical work.
Final Thoughts
Data analytics creates value when reliable data is transformed into understandable evidence that supports better decisions.
Excel, SQL, Python, and visualization platforms provide the technical foundation, but the quality of the analysis depends on how carefully the problem is defined, the data is validated, and the findings are interpreted.
For anyone developing analytics skills, focus on complete projects rather than isolated tools. Learn to investigate a question, document your methods, validate your calculations, and communicate what the evidence actually supports.
That is the difference between building a dashboard and delivering analysis that people can use.